Thread Local Storage, part 2: Explicit TLS

October 23rd, 2007

Previously, I outlined some of the general design principles behind both flavors of TLS in use on Windows. Anyone can see the design and high level interface to TLS by reading MSDN, though; the interesting parts relate to the implementation itself.

The explicit TLS API is (by far) the simplest of the two classes of TLS in terms of the implementation, as it touches the fewest “moving parts”. As I mentioned last time, there are really just four key functions in the explicit TLS API. The most important two are TlsGetValue and TlsSetValue, which manage the actual setting and retrieving of per-thread pointers.

These two functions are simple enough to annotate entirely. The essential mechanism behind them is that they are basically just “dumb accessors” into an array (two arrays in actuality, TlsSlots and TlsExpansionSlots) in the TEB, which is indexed by the dwTlsIndex argument to return (or set) the desired per-thread variable. The implementation of TlsGetValue on Vista (32-bit) is as follows (TlsSetValue is similar, except that it writes to the arrays instead of reading from them, and has support for demand-allocating the TlsExpansionSlots array; more on that later):

PVOID
WINAPI
TlsGetValue(
	__in DWORD dwTlsIndex
	)
{
   PTEB Teb = NtCurrentTeb(); // fs:[0x18]

   // Reset the last error state.
   Teb->LastErrorValue = 0;

   // If the variable is in the main array, return it.
   if (dwTlsIndex < 64)
      return Teb->TlsSlots[ dwTlsIndex ];

   if (dwTlsIndex > 1088)
   {
      BaseSetLastNTError( STATUS_INVALID_PARAMETER );
      return 0;
   }

   // Otherwise it's in the expansion array.
   // If it's not allocated, we default to zero.
   if (!Teb->TlsExpansionSlots)
      return 0;

   // Fetch the value from the expansion array.
   return Teb->TlsExpansionSlots[ dwTlsIndex - 64 ];
}

(The assembler version (annotated) is also available.)

The TlsSlots array in the TEB is a part of every thread, which gives each thread a guaranteed set of 64 thread local storage indexes. Later on, Microsoft decided that 64 was not enough TLS slots to go around and added the TlsExpansionSlots array, for an additional 1024 TLS slots. The TlsExpansionSlots array is demand-allocated in TlsAlloc if the initial set of 64 slots is exceeded.

(This is, by the way, the nature of the seemingly arbitrary 64 and 1088 TLS slot limitations mentioned by MSDN, for those keeping score.)

TlsAlloc and TlsFree are, for all intents and purposes, implemented just as what one would expect. They acquire a lock, search for a free TLS slot (returning the index if one is found), otherwise indicating to the caller that there are no free slots. If the first 64 slots are exhausted and the TlsExpansionSlots array has not been created, then TlsAlloc will allocate and zero space for 1024 more TLS slots (pointer-sized values), and then update the TlsExpansionSlots to refer to the newly allocated storage.

Internally, TlsAlloc and TlsFree utilize the Rtl bitmap package to track usage of individual TLS slots; each bit in a bitmap describes whether a particular TLS slot is free or in use. This allows for reasonably fast (and space efficient) mapping of TLS slot usage for book-keeping purposes.

If one has been following along so far, then the question as to what happens when TlsAlloc is called such that it must create the TlsExpansionSlots array after there is already more than one thread in the current process may have come to mind. This might appear to be a problem at first glance, as TlsAlloc only creates the array for the current thread. Although one might be tempted to conclude that, given this behavior of TlsAlloc, explicit TLS therefore doesn’t work reliably above 64 TLS slots if the extra slots are allocated after the second thread in the process is created, this is in fact not the case. There exists some clever sleight of hand that is performed by TlsGetValue and TlsSetValue, which compensates for the fact that TlsAlloc can only create the TlsExpansionSlots memory block for the current thread.

Specifically, if TlsGetValue is called with an array index within the confines of the TlsExpansionSlots array, but the array has not been allocated for the current thread, then zero is returned. (This is the default value for an uninitialized TLS slot, and is thus consequently legal.) Similarly, if TlsSetValue is called with an array index that falls under the TlsExpansionSlots array, and the array has not yet been created, TlsSetValue allocates the memory block on demand and initializes the requested TLS slot.

There also exists one final twist in TlsFree that is required to support the behavior of releasing a TLS slot while there are multiple threads running. A potential problem exists whereby a thread releases a TLS slot, and then it becomes reallocated, following which the previous contents of the TLS slot are still present on other threads running in the process. TlsFree alleviates this problem by asking the kernel for help, in the form of the ThreadZeroTlsCell thread information class. When the kernel sees a NtSetInformationThread call for ThreadZeroTlsCell, it enumerates all threads in the process and writes a zero pointer-length value to each running thread’s instance of the requested TLS slot, thus flushing the old contents and resetting the slot to the unallocated default state. (It is not strictly necessary for this to have been done in kernel mode, although the designers chose to go this route.)

When a thread exits normally, if the TlsExpansionSlots pointer has been allocated, it is freed to the process heap. (Of course, if a thread is terminated by TerminateThread, the TlsExpansionSlots array is leaked. This is yet one reason among innumerable others why you should stay away from TerminateThread.)

Next up: Examining implicit TLS support (__declspec(thread) variables).

Thread Local Storage, part 1: Overview

October 22nd, 2007

Windows, like practically any other mainstream multithreading operating system, provides a mechanism to allow programmers to efficiently store state on a per-thread basis. This capability is typically known as Thread Local Storage, and it’s quite handy in a number of circumstances where global variables might need to be instanced on a per-thread basis.

Although the usage of TLS on Windows is fairly well documented, the implementation details of it are not so much (though there are a smattering of pieces of third party documentation floating out there).

Conceptually, TLS is in principal not all that complicated (famous last words), at least from a high level. The general design is that all TLS accesses go through either a pointer or array that is present on the TEB, which is a system-defined data structure that is already instanced per thread.

The “per-thread” resolution of the TEB is fairly well documented, but for the benefit of those that are unaware, the general idea is that one of the segment registers (fs on x86, gs on x64) is repurposed by the OS to point to the base address of the TEB for the current thread. This allows, say, an access to fs:[0x0] (or gs:[0x0] on x64) to always access the TEB allocated for the current thread, regardless of other threads in the address space. The TEB does really exist in the flat address space of the process (and indeed there is a field in the TEB that contains the flat virtual address of it), but the segmentation mechanism is simply used to provide a convenient way to access the TEB quickly without having to search through a list of thread IDs and TEB pointers (or other relatively slow mechanisms).

On non-x86 and non-x64 architectures, the underlying mechanism by which the TEB is accessed varies, but the general theme is that there is a register of some sort which is always set to the base address of the current thread’s TEB for easy access.

The TEB itself is probably one of the best-documented undocumented Windows structures, primarily because there is type information included for the debugger’s benefit in all recent ntdll and ntoskrnl.exe builds. With this information and a little disassembly work, it is not that hard to understand the implementation behind TLS.

Before we can look at the implementation of how TLS works on Windows, however, it is necessary to know the documented mechanisms to use it. There are two ways to accomplish this task on Windows. The first mechanism is a set of kernel32 APIs (comprising TlsGetValue, TlsSetValue, TlsAlloc, and TlsFree that allows explicit access to TLS. The usage of the functions is fairly straightforward; TlsAlloc reserves space on all threads for a pointer-sized variable, and TlsGetValue can be used to read this per-thread storage on any thread (TlsSetValue and TlsFree are conceptually similar).

The second mechanism by which TLS can be accessed on Windows is through some special support from the loader (residing ntdll) and the compiler and linker, which allow “seamless”, implicit usage of thread local variables, just as one would use any global variable, provided that the variables are tagged with __declspec(thread) (when using the Microsoft build utilities). This is more convenient than using the TLS APIs as one doesn’t need to go and call a function every time you want to use a per-thread variable. It also relieves the programmer of having to explicitly remember to call TlsAlloc and TlsFree at initialization time and deinitialization time, and it implies an efficient usage of per-thread storage space (implicit TLS operates by allocating a single large chunk of memory, the size of which is defined by the sum of all per-thread variables, for each thread so that only one index into the implicit TLS array is used for all variables in a module).

With the advantages of implicit TLS, why would anyone use the explicit TLS API? Well, it turns out that prior to Windows Vista, there are some rather annoying limitations baked into the loader’s implicit TLS support. Specifically, implicit TLS does not operate when a module using it is not being loaded at process initialization time (during static import resolution). In practice, this means that it is typically not usable except by the main process image (.exe) of a process, and any DLL(s) that are guaranteed to be loaded at initialization time (such as DLL(s) that the main process image static links to).

Next time: Taking a closer look at explicit TLS and how it operates under the hood.

The optimizer has different traits between the x86 and x64 compilers

October 19th, 2007

Last time, I described how the x86 compiler sometimes optimizes conditional assignments.

It is worth adding to this sentiment, though, that the x64 compiler is in fact a different beast from the x86 compiler. The x64 instruction set brings new guaranteed-universally-supported instructions, a new calling convention (with new restrictions on how the stack is used in functions), and an increased set of registers. These can have a significant impact on the compiler.

As an example, let’s take a look at what the x64 compiler did when compiling (what I can assume) is the same source file into the code that we saw yesterday. There are a number of differences even with the small section that I posted that are worth pointing out. The approximately equivalent section of code in the x64 version is as so:

cmp     cl, 30h
mov     ebp, 69696969h
mov     edx, 30303030h
mov     eax, ebp
mov     esi, 2
cmovnz   eax, edx
mov     [rsp+78h+PacketLeader], eax

There are a number of differences here. First, there’s a very significant change that is not readily apparent from the small code snippets that I’ve pasted. Specifically, in the x86 build of this particular module, this code resided in a small helper subfunction that was called by a large exported API. With the x64 build, by contrast, the compiler decided to inline this function into its caller. (This is why this version of the code just stores the value in a local variable instead of storing it through a parameter pointer.)

Secondly, the compiler used cmovnz instead of going to the trouble of using the setcc, dec, and route. Because all x64 processors support the cmovcc family of instructions, the compiler has a free hand to always use them for any x64 platform target.

There are a number of different reasons why the compiler might perform particular optimizations. Although I’m hardly on the Microsoft compiler team, I might be able to hazard a guess as to why, for instance, the compiler might have decided to inline this code chunk instead of leaving it in a helper function as in the x86 build.

On x86, the call to this helper function looks like so:

push    [ebp+KdContext]
lea     eax, [ebp+PacketLeader]
push    eax
push    [ebp+PacketType]
call    _KdCompReceivePacketLeader@12

Following the call instruction, throughout the main function, there are a number of comparisons between the PacketLeader local variable (that was filled in by KdCompReceivePacketLeader) and one of the constants (0x69696969) that we saw PacketLeader being set to in the code fragment. To be exact, there are three occurances of the following in short order after the call (though there are control flow structures such as loops in between):

cmp     [ebp+PacketLeader], 69696969h

These are invariably followed by a conditional jump to another location.

Now, when we move to x64, things change a bit. One of the most significant differences between x64 and x86 (aside from the large address space of course) is the addition of a number of new general purpose registers. These are great for the optimizer, as they can allow for a number of things to be cached in registers instead of having to be either spilled to the stack or, in this case, encoded as instruction operands.

Again, to be clear, I don’t work on the x64 compiler, so this is really just my impression of things based on logical deduction. That being said, it would seem to me that one sort of optimization that you might be able to make easier on x64 in this case would be to replace all the large “cmp” instructions that reference the 0x69696969 constant with a comparison against a value cached in a register. This is desirable because a cmp instruction that compares a value dereferenced based on ebp (the frame pointer, in other words, a local variable) with a 4-byte immediate value (0x69696969) is a whopping 7 bytes long.

Now, 7 bytes might not seem like much, but little things like this add up over time and contribute to additional paging I/O by virtue of the program code being larger. Paging I/O is very slow, so it is advantageous for the compiler to try to reduce code size where possible in the interest of cutting down on the number of code pages.

Because x64 has a large number of extra general purpose registers (compared to x86), it is easier for the compiler to “justify” the “expenditure” of devoting a register to, say, caching a frequently used value for purposes of reducing code size.

In this particular incident, because the 0x69696969 constant is both referenced in the helper function and the main function, one benefit of inlining the code would be that it would be possible to “share” the constant in a cached register across both the reference in the helper function code and all the comparisons in the main function.

This is essentially what the compiler does in the x64 version. 0x69696969 is loaded into ebp, and depending on the condition flags when the cmovnz is executed will remain loaded into eax based off of a mov eax, ebp instruction.

Later on in the main function, comparisons against the 0x69696969 constant are performed via a check against ebp instead of an immediate 4-byte operand. For example, the long 7-byte cmp instructions on x86 become the following 4 byte instructions on x64:

cmp     [rsp+78h+PacketLeader], ebp

I’m sure this is probably not the only reason why the function was inlined for the x64 build and not the x86 build, but the optimizer is fairly competent, and I’d be surprised if this kind of possible optimization wasn’t factored in. Other reasons in favor of inlining on x64 are, for instance, the restrictions that the (required) calling convention places against the sort of custom calling conventions possible on x86, and the fact that any non-leaf function that isn’t inlined requires its own unwind metadata entries in the exception directory (which, for small functions, can be a non-trivial amount of overhead compared to the opcode length of the function itself).

Aside from changes about decisions on whether to inline code or not, there are a number of new optimizations that are exclusive to x64. That, however, is a topic for another day.

Compiler tricks in x86 assembly: Ternary operator optimization

October 18th, 2007

One relatively common compiler optimization that can be handy to quickly recognize relates to conditional assignment (where a variable is conditionally assigned either one value or an alternate value). This optimization typically happens when the ternary operator in C (“?:”) is used, although it can also be used in code like so:

// var = condition ? value1 : value2;
if (condition)
  var = value1;
else
  var = value2;

The primary optimization that the compiler would try to make here is the elimination of explicit branch instructions.

Although conditional move operations were added to the x86 instruction set around the time of the Pentium II, the Microsoft C compiler still does not use them by default when targeting x86 platforms (in contrast, x64 compiler uses them extensively). However, there are still some tricks that the compiler has at its disposal to perform such conditional assignments without branch instructions.

This is possible through clever use of the “conditional set (setcc)” family of instructions (e.g. setz), which store either a zero or a one into a register without requiring a branch. For example, here’s an example that I came across recently:

xor     ecx, ecx
cmp     al, 30h
mov     eax, [ebp+PacketLeader]
setnz   cl
dec     ecx
and     ecx, 0C6C6C6C7h
add     ecx, 69696969h
mov     [eax], ecx

Broken up into the individual relevant steps, this code is something along the lines of the following in pseudo-code:

if (eax == 0x30)
  ecx = 0;
else
  ecx = 1;

ecx--; // after, ecx is either 0 or 0xFFFFFFFF (-1)
ecx &= 0x30303030 - 0x69696969; // 0xC6C6C6C7
ecx += 0x69696969;

The key trick here is the use of a setcc instruction, followed by a dec instruction and an and instruction. If one takes a minute to look at the code, the meaning of these three instructions in sequence becomes apparent. Specifically, a setcc followed by a dec sets a register to either 0 or 0xFFFFFFFF (-1) based on a particular condition flag. Following which the register is ANDed with a constant, which depending on whether the register is 0 or -1 will result in the register being set to the constant or being left at zero (since anything AND zero is zero, while ANDing any particular value with 0xFFFFFFFF yields the input value). After this sequence, a second constant is summed with the current value of the register, yielding the desired result of the operation.

(The initial constant is chosen such that adding the second constant to it results in one of the values of the conditional assignment, where the second constant is the other possible value in the conditional assignment.)

Cleaned up a bit, this code might look more like so:

*PacketLeader = (eax == 0x30 ? 0x30303030 : 0x69696969);

This sort of trick is also often used where something is conditionally set to either zero or some other value, in which case the “add” trick can be omitted and the non-zero conditonal assignment value is used in the AND step.

A similar construct with the sbb instruction and the carry flag can also be constructed (as opposed to setcc, if sbb is more convenient for the particular case at hand). For example, the sbb approach tends to be preferred by the compiler when setting a value to zero or -1 as a further optimization on this theme as it avoids the need to decrement, assuming that the input value was already zero initially and the condition is specified via the carry flag.

You know that security is becoming mainstream when it shows up in comics…

October 17th, 2007

I recently saw a link to a rather amusing XKCD comic strip in one of the SILC channels that I frequent. I don’t usually forward these sorts of things along, but this one seemed unique enough to warrant it:

Exploits of a Mom

Hey, nobody said that security can’t have a little humor injected into it from time to time.

SQL injection attacks continue to be one of the most common attack vectors for web-based applications. I recently saw someone just search through random links found via Google that were to dynamically generated pages which took some sort of database identifier on their query string. The idea was to change the URLs found to have “dangerous” characters in their query parameters, and then see who died with a database error. The number of sites running code that didn’t escape obvious database queries in Q4 2007 was quite depressing, as I recall.

Terminal Server tricks: Restrict “\\tsclient” drive redirection to certain directories

October 16th, 2007

One particularly handy feature of recent Terminal Server (MSTSC) clients is the capability to redirect drives to the remote TS / RDP server for use in the RDP session. This is the mechanism by which you can go to \\tsclient\<driveletter> and access your data over the RDP session, without having to try and map a drive back the computer hosting the session via SMB or the like.

Although this capability is convenient, in its present form it is limited to just mapping entire drive letters; there does not appear to be a way to limit the scope of the filesystem that is redirected to a remote system to anything less than an entire drive letter. This is unfortunate, as especially with RDP-TLS, drive mapping over RDP presents a simple, secure, and attractive file copy mechanism for computers that that you want can RDP into.

The unfortunate part is more that if you don’t trust the computer that you are remoting into completely, then it’s rather dangerous to give it unrestricted access (within the confines of the user account mstsc.exe is executing as) to local drives; there’s a lot of damage that a malicious RDP server could do with that kind of access. Even if you’re a limited user, the RDP server could still steal and/or trash all your personal documents (which are again usually the most valuable data on a computer anyway).

There is, however, a little trick that you can use to try to limit the scope of RDP drive mappings. Recall that mstsc redirects drives based on drive letters; this would at first glance seem to prevent one from using any finer granularity of access than entire volumes with respect to which portions of the filesystem are made available to the RDP server. This is not actually the case if one is a bit clever, however, because RDP can also remote drive letters that correspond to mapped network drives, and not just local volumes that have a drive letter associated with them.

With this trick, one can, say, map a drive letter to localhost at a directory under a particular drive, to be the “root directory” that is presented to the remote RDP server. From there, it’s possible to just redirect the mapped drive letter over RDP and restrict what portions of the local filesystem are accessible to the RDP server.

Note that until Vista, plain users cannot arbitrarily map to \\localhost\c$ (or other built-in shares). As a result, if you’re in the pre-Vista boat (on the client side), an administrator will need to create the share for you (since you are running as a limited user, right?) so that you can map a drive letter to it.

Edit: Hyperion points out that you can use the “subst” command to achieve the same effect as mapping a drive letter to localhost. This is actually better than what I had been doing with drive mappings, as in downlevel (pre-Vista) scenarios, you don’t have the extra headache of having to get an administrator to share out a directory for you to be able to map it as a plain user.

Things that make you go “hmm”…

October 15th, 2007

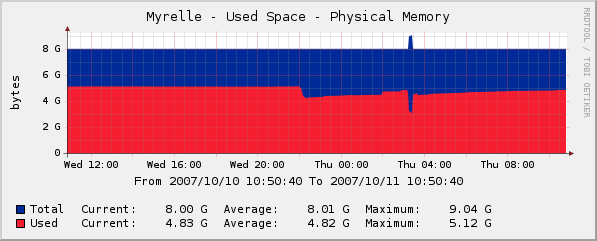
Evidently, a couple nights ago at 2:30am or so, my datacenter box grew an extra ~1GB of RAM for about 10 minutes:

Myrelle - Physical Memory Usage

Unfortunately, the magical mystery RAM (for lack of a better word) disappeared after about 10 minutes. Too bad, more RAM would have always been welcome…

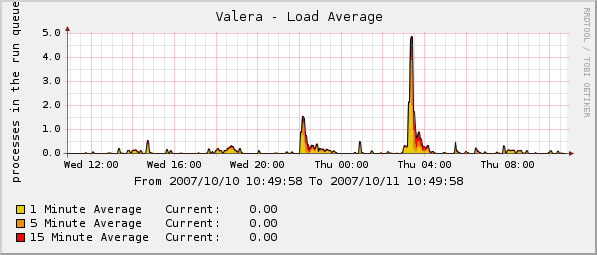
It seems that there’s some sort of strange bug with either Cacti or the SNMP utilities that it is using to query data, which occurs when the box is under load. At the time when the anomalous measurements were returned, there was a transitory jump in load average on the monitoring system (if the Cacti graphs are to be believed this time around):

Valera - Load Average

(Did I mention that things have a general tendency to break in strange and mysterious ways while in my presence?)

Anyways, now I have to wonder how reliable my other Cacti graphs are after this little discovery. This time, at least, the discrepancy was fairly obvious…

Fast kernel debugging for VMware, part 7: Review and Final Comments

October 12th, 2007

This is the final post in the VMKD series, a set of articles describing a program that greatly enhances the performance of kernel debugging in VMware virtual machines.

The following posts are members of the VMKD series:

  1. Fast kernel debugging for VMware, part 1: Overview
  2. Fast kernel debugging for VMware, part 2: KD Transport Module Interface
  3. Fast kernel debugging for VMware, part 3: Guest to Host Communication Overview
  4. Fast kernel debugging for VMware, part 4: Communicating with the VMware VMM
  5. Fast kernel debugging for VMware, part 5: Bridging the Gap to DbgEng.dll
  6. Fast kernel debugging for VMware, part 6: Roadmap to Future Improvements
  7. Fast kernel debugging for VMware, part 7: Review and Final Comments

At this point, the basic concepts behind how VMKD accelerates the kernel debugging experience in VMware should at the very least be vaguely familiar. This doesn’t mean that the story ends with VMKD, however. Many of the general, high-level concepts that VMKD uses to improve the performance of kernel debugging guests can be applied to other areas of the system.

That is to say, there are a number of implications outside of simply kernel debugging that are worth considering in the new reality that pervasive virtualization presents to us. Virtualization aware operating systems and applications present the potential for significant improvements in performance, user experience, and raw capabilities pretty much across the board as we move from seeing virtualization as a way to abstract interfaces intended to communicate with real hardware into a world where operating systems and drivers may more commonly be fully cognizent of the fact that they are operating in a VM. For example, one could conceivably imagine a time when 3D video performance approaches native performance on “bare metal”, thanks to virtualization awareness in display drivers and the interfaces they use to talk to the outside world.

In that respect, it seems logical to me that there may eventually become a time when virtualization is no longer simply about creating the virtual illusion of a physical machine. Instead, it may come to pass that virtualization ends up being more about providing an optimized “virtual platform” that does away with the constraints of hardware interfaces that are designed to be accessed by a single operating system at at time, in favor of a more abstract model where resources are natively accessed and shared by virtualized operating systems in a fashion that considers a virtual platform as a first class citizen rather than a mere echo of a physical machine.

Virtualization is here to stay. The sooner that it becomes accepted as a first class citizen in the operating system world, the better, I say.

Fast kernel debugging for VMware, part 6: Roadmap to Future Improvements

October 11th, 2007

Yesterday’s article described how VMKD currently communicates with DbgEng.dll in order to complete the high-speed connection between a local kernel debugger and the KD stub code running in a VM. At this point, VMKD is essentially operational, with significant improvements over conventional virtual serial port kernel debugging.

That is not to say, however, that nothing remains that could be improved in VMKD. There are a number of areas where significant steps forward could be taken with respect to either performance or end user experience, given a native (in the OS and in VMMs) implementation of the basic concepts behind VMKD. For example, despite the greatly accelerated data rate of VMKD-style kernel debugging, the 1394 kernel debugger transport still outpaces it for writing dump files. (Practically speaking, all operations except writing dump files are much faster on VMKD when compared to 1394.)

This is because the 1394 KD transport can “cheat” when it comes to physical memory reads. As the reader may or may not be aware, 1394 essentially provides an interface to directly access the target’s raw physical memory. DbgEng takes advantage of this capability, and overrides the normal functionality for reading physical memory on the target. Where all other transports send a multitude of DbgKdReadPhysicalMemoryApi packets to the target computer, requesting chunks of physical memory 4000 bytes at a time (4000 bytes is the maximum size of a KD packet across any transport), the 1394 KD client in DbgEng simply pulls the target computer’s physical memory directly “off the wire”, without needing to invoke the DbgKdReadPhysicalMemoryApi request for every 4000 bytes.

This optimization turns out to present very large performance improvements with respect to reading physical memory, as a request to write a dump file is at heart essentially just a large memcpy request, asking to copy the entire contents of physical memory of the target computer to the debugger so that the data can be written to a file. The 1394 KD client approach greatly reduces the amount of code that needs to run for every 4000 bytes of memory, especially in the VM case where every KD request and response pair involve separate VM exits and all the code that such operations involve, on top of all the processing logic guest-side when handling the DbgKdReadPhysicalMemoryApi request and sending the response data.

The same sort of optimization can of course be done in principal for virtual machine kernel debugging, but DbgEng lacks a pluggable interface to perform the highly optimized transfer of raw physical memory contents across the wire. One optimization that could be done without the assistance of DbgEng would be to locally interpret the DbgKdReadPhysicalMemoryApi request VMM-side and handle it without ever passing the request on to the guest-side code, but even this is suboptimal as it introduces a (admittedly short for a local KD process) round trip for every 4000 bytes of physical memory. If the DbgEng team stepped up to the plate and provided such an extensible interface, it would be much easier to provide the sort of speeds that one sees with writing dumps based on local KD.

Another enhancement that could be done Microsoft-side would be a better interface for replacing KD transport modules. Right now, due to the fact that ntoskrnl is static linked to KDCOM.DLL, the OS loader has a hardcoded hack that interprets the KD type in the OS loader options, loads one of the (hardcoded filenames) “kdcom.dll”, “kd1394.dll”, or “kdusb2.dll” modules, and inserts them into the loaded module list under the name “kdcom.dll”. Additionally, the KD transport module appears to be guarded by PatchGuard on Windows x64 editions (at least from the standpoint of PatchGuard 3), and on Windows Vista, Winload.exe enforces a signature check on the KD transport module. These checks are, unfortunately, not particularly conducive to allowing a third party to easily plug themselves into the KD transport path. (Unless virtualization vendors standardize on a way to signal the VMM that the guest wants attention, each virtualization platform is likely to need some slightly different code to effect a VM exit on each KdSendPacket and KdReceivePacket operation.)

Similarly, there are a number of enhancements that virtualization platform vendors could make VMM-side to make the VMKD-style approach more performant. For example, documented pluggable interfaces for communicating with the guest would be a huge step forward (although the virtualization vendor could just implement the whole KD transport replacement themselves instead of relying on a third party solution). VMware appears to be exploring this approach with VMCI, although this interface is unfortunately not supported on VMware Server or any other platforms besides VMware Workstation 6 to the best of my knowledge. Additionally, VMM authors are in the best position to provide documented and supported interfaces to allow pluggable code designed to interface with a VMM to directly access the register, physical, and virtual memory contexts of a given VM.

Virtualization vendors are also in a better position to integrate the installation and activation process for VMM plugins than a third party operating with no support or documentation. For example, the clumsy vmxinject.exe approach that VMKD takes to load its plugin code into the VMware VMM could be completely eliminated by a native architecture for installing, configuring, and loading VMM plugins (VMCI promises to take care of some of this, though not entirely to the extent that I’d hope).

I would strongly encourage Microsoft and virtualization vendors to work together on this front, as at least from the debugging experience (which is a non-trivial, popular use of virtual machines), there’s a significant potential for a better customer experience in the VM kernel debugging arena with a little cooperation here and there. VMKD is essentially a proof of concept showing that vast kernel debugging is absolutely technically possible for Windows virtual machines. Furthermore, with “inside knowledge” of either the kernel or the VMM, it would likely be trivial to implement the sort of pluggable interfaces that would have made the development and testing of VMKD a virtual walk in the park. In other words, if VMKD can be done without help from either Microsoft or VMware, it should be simple for virtualization vendors and Microsoft to implement similar functionality if they work together.

Next time: Parting shots, and thoughts on other improvements beyond simply fast kernel debugging in the virtualization space.

Fast kernel debugging for VMware, part 5: Bridging the Gap to DbgEng.dll

October 10th, 2007

The previous article in the virtualized kernel debugging series described some of the details behind how VMKD communicates with the outside world via some modifications to the VMware VMM.

Although getting from the operating system kernel to the outside world is certainly an important milestone with respect to improved virtual machine kernel debugging, it is still necessary to somehow connect the last set of dots between the modified VMware VMM and the debugger (DbgEng.dll). The debugger doesn’t really have native support for what VMKD attempts to do. Like the KD transport module code that runs in kernel mode on the target, DbgEng expects to be talking to a hardware interface (through a user mode accessible API) in order to send and receive data from the target.

There is some support in DbgEng that can be salvaged to communicate with the VMM-side portion of VMKD, which is the “native” support for debugging over named pipe (or TCP, the latter being apparently functional but completely undocumented, which is perhaps unsurprising as there’s no public server end for that as there is for named pipe kernel debugging). However, there’s a problem with using this part of DbgEng’s support for kernel debugging. Although it does allow us to easily talk to DbgEng without having to patch it (a definite plus, as patching two completely isolated programs from two different vendors is a recipe for an extremely brittle program), this support for named pipe or TCP transports for KD is not without its downsides.

Specifically, the named pipe and TCP transport logic is essentially a bolt-on, after-the-fact addition to the serial port (KDCOM) support in DbgEng. (This is why, among other things, kernel debugging over named pipe always starts with kd -k com:pipe,….) What this means in terms of VMKD is that DbgEng expects that anything that it would be speaking to over named pipe or TCP is going to be implementing the low-level KDCOM framing protocol, with the high level KD protocol running on top of that. The KDCOM framing protocol is unfortunately a fairly unwieldy and messy protocol (it is designed to work with minimal dependencies and without a reliable way of knowing whether the remote end of the serial port is even connected, much less receiving data).

Essentially, the KDCOM framing protocol is to TCP as the high level KD protocol is to, say, HTTP in terms of networking protocols. KDCOM takes care of all the low level goo with respect to retransmits, acknowledgments, and everything else about establishing and maintaining a reliable connection with the remote end of the kernel debugger connection. While KDCOM is nowhere near as complex as TCP (thankfully!), it is not without its share of nuances, and it is certainly not publicly documented. (There was originally some partial documentation of an ancient version of the KDCOM protocol released in the NT 3.51 DDK in terms of source code to a partially operational kernel debugger client, with additional aspects covered in the Windows 2000 DDK. There is unfortunately no mention at all of any of this in any recent DDKs or WDKs, as KDCOM has long since disappeared into “no longer documented land”, an irritating habit of many old kernel APIs.)

The fact that there is no way to directly inject high level KD protocol data into DbgEng (aside from patching non-exported internal routines in the debugger, which is certainly no desirable from a future compatibility standpoint) presents a rather troublesome problem. By virtue of taking the approach of replacing KdSendPacket and KdReceivePacket in the guest, the code that was formerly responsible for maintaining the server-end of the low-level KDCOM link is no longer in use. That is, the data coming out of the kernel is raw high-level KD protocol data and not KDCOM data, and yet DbgEng can only interpret KDCOM-framed data over TCP or named pipe.

The solution that I ended up developing to counteract this problem, while a logical consequence of this limitation, is nonetheless unwieldy. In order to communicate with DbgEng, VMKD essentially had to re-implement the entire low-level KDCOM framing protocol so that KD packets can be transferred to and received from an unmodified DbgEng using the already-existing KDCOM over named pipe support. This approach entailed a rather unfortunate amount of extra baggage that needed to be carried around as many features of the KDCOM protocol are unnecessary in light of the new environment that local virtual machine kernel debugging presents.

In the interests of both reducing the complexity of the kernel mode code running in guest operating systems and improving the performance of VMKD (with respect to any possible “overhead traffic”, such as retransmits or resynchronization related requests), the KDCOM framing protocol is implemented host-side in the logic that is running in the modified VMM. This approach also had the additional advantage (during the development process) of the KDCOM framing logic being relatively easily debuggable with a conventional debugger on the host machine. This is in stark contrast to almost all of the guest-side kernel mode driver, which by virtue of being right in the middle of the communication path with the kernel debugger itself, happens to be unfortunately immune to being debugged via the conventional kernel debugger. (A VMM-implemented OS-agnostic debugger, similar in principal to a hardware debugger (ICE) could conceivably have been used to debug the guest-side driver logic if necessary, but putting the KDCOM framing code in user mode host-side is simply much more convenient.)

The KDCOM framing code in the host-side portion of VMKD fulfills the last major piece of the project. At this point, it is now possible to get kernel debugger send and receive requests into and out of the kernel with an accelerated interface that is optimized for execution in a VM, and successfully transport this data to and from DbgEng for consumption by the kernel debugger.

One alternative that I explored to intercepting execution at KdSendPacket and KdReceivePacket guest-side was to simply hook the internal KDCOM routines for sending and receiving characters from the serial port. This approach, while saving the trouble of having to reimplement KDCOM essentially from the ground up, proved problematic and less reliable than I had initially hoped (I suspect timing and buffering differences from a real 16-byte-buffering UART were at fault for the reliability issues this approach encountered). Furthermore, such an approach was in general somewhat less performant than the KdSendPacket and KdReceivePacket solution, as all of the KDCOM “meta-traffic” with respect to resends, acknowledgments, and the like needed to traverse the guest to host boundary instead of being confined to just the host as in the model that VMKD uses currently.

Next time: Future directions that could be taken on VMKD’s general approach to improving the kernel debugging experience with respect to virtual machines.